Log in

Sign up for our weekly newsletter!

From the Supporting Data Science workshop

Posted: Feb, 23, 2013

By: Cathryn CARSON

Upwards of 60 [correction: 70] attendees at this morning's Supporting Data Science workshop, organized by VC Research. Pretty amazing for something organized in 3 days and held at 8 a.m. on a Saturday. More amazing: it actually worked. The program is here.

Read →

Software Carpentry bootcamps

What: Our goal is to help scientists and engineers become more productive by teaching them basic computing skills like program design, version control, testing, and task automation. In this two-day boot camp, short tutorials will alternate with hands-on practical exercises. Participants will be encouraged both to help one another, and to apply what they have learned to their own research problems during and between sessions. There will be online follow up sessions for 6 to 8 weeks extending the material from the boot camp.

Supporting Data Science workshop - Sat 2/23

Posted: Feb, 21, 2013

By: Cathryn CARSON

There'll be a workshop this Saturday, Feb. 23, 8:00 (eek) - 11:00 am on how Berkeley can create new institutional ecologies for "data science." This is a fast attempt to develop on-the-ground knowledge of what works, doesn't work, and could work for "data science" here. It's to support a proposal to two foundations that Berkeley hopes to put in the very short term.

Read →

Introduction to R for Absolute Beginners

Aimed at students with no background knowledge in programming languages or statistics. Participants will be led step-by-step through the basics of using R for data exploration and analysis, with an emphasis on developing core skills that can be ported over to one's own data sets.

Introduction to Data Mapping

Learn how Geographical Information Systems (GIS) can transform data into visually descriptive maps. Key Takeaways: Learn critical GIS mapping concepts Resources for obtaining public GIS data

Communicating with Maps

Understand the use of maps as an effective medium in storytelling. Key Takeaways: The basic elements of a map, including location, context and hierarchy. Explore how different map types communicate distinctly unique information. Techniques for creating effective maps

Introduction to Data Visualization

Examine visualization techniques for illustrating data. Key Takeaways: Understanding the impact of data on storytelling How to varying mediums require different storytelling techniques Key skills for communicating data effectively

Spreadsheet Basics

Get started in data journalism with the basics of spreadsheets. This interactive, instructor led workshop introduces the essential skills necessary for working with spreadsheets. The workshop is also available as an on-line tutorial. Key Takeaways: Knowledge of and working with the main components of a spreadsheet: cells, rows, columns How to enter data into a spreadsheet Use of formulas to perform simple mathematical calculations Working with functions in large datasets

We have lift-off.

Posted: Feb, 15, 2013

By: Cathryn CARSON

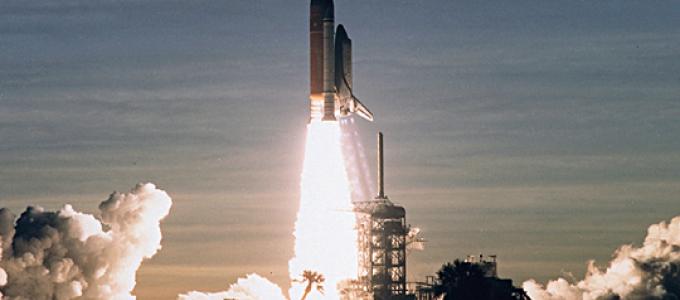
We talk about launching D-Lab. That's how it feels -- lifting a massive payload into orbit. There have been months of planning and training, and now the boosters are firing. Even a historian of Cold War science and technology can't be ironic about how incredible it is to see the thing slowly lift off the ground.

Our doors open on Tuesday, February 19. We haven't planned any opening festivities. We've put all our effort into getting ready to launch. We'll have a formal celebration later, to mark our opening and to thank everyone whose work was necessary to get us to this point.

Read →

Pages