The advent of the Big data exploitation has led to an increased focus on data-driven decision making. These changes have created giant leaps in technology for different sectors including health care, supply chains, agriculture,online retailing among others. However, in developing regions the implementation and performance of many of these methods is stunted due to the limitations in available data sets.
The problem with data in many developing countries is three fold. The data is usually either restricted, very incomplete or nonexistent. Data restrictions can be addressed by creating collaborations with governments and companies that can allow access to the data. However, these restricted data sets are still few and far between. The data needed to implement the bulk of the available methods to solve problems lie in the second and third categories. As a result, researchers need to make active efforts to obtain and populate existing data sources. In addition, working in data sparse environments requires the use of creative techniques that can allow researchers to make useful inferences using approximations of the data.
In a recent project, I worked in a team of 4 graduate students to characterize the Freetown Peninsula in Sierra Leone under data sparse data conditions.[1] Freetown is plagued by several natural hazards, particularly landslides, due to its proximity to the ocean and mountainous topography. Understanding the vulnerability such a topography presents is essential for infrastructure and social welfare investments. Throughout our analysis we used population density data obtained from Landscan ( a global population distribution data set) and the location of popular attractions, called points of interest (POI), scraped from Google Maps.
Some of the techniques we used are described below.
Population Dynamics:
In order to assess the population spread within Freetown, Sierra Leone we applied Clustering and Oercolation techniques on population density data.
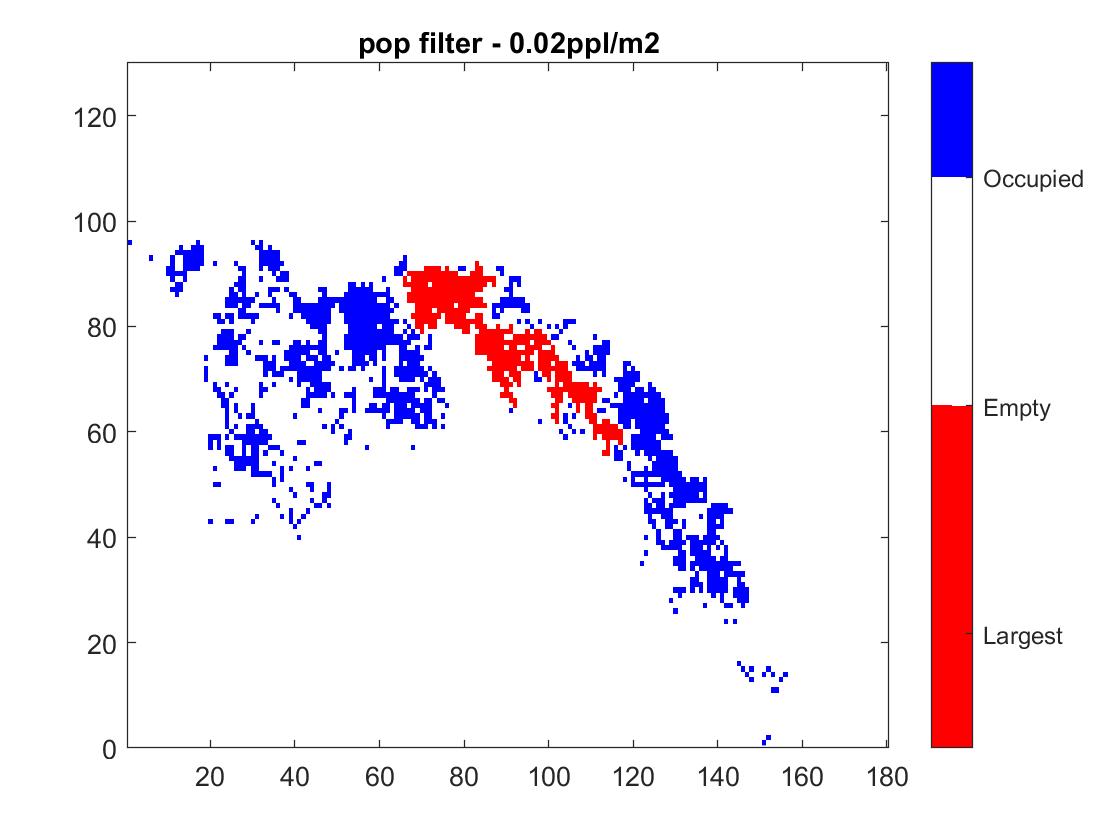
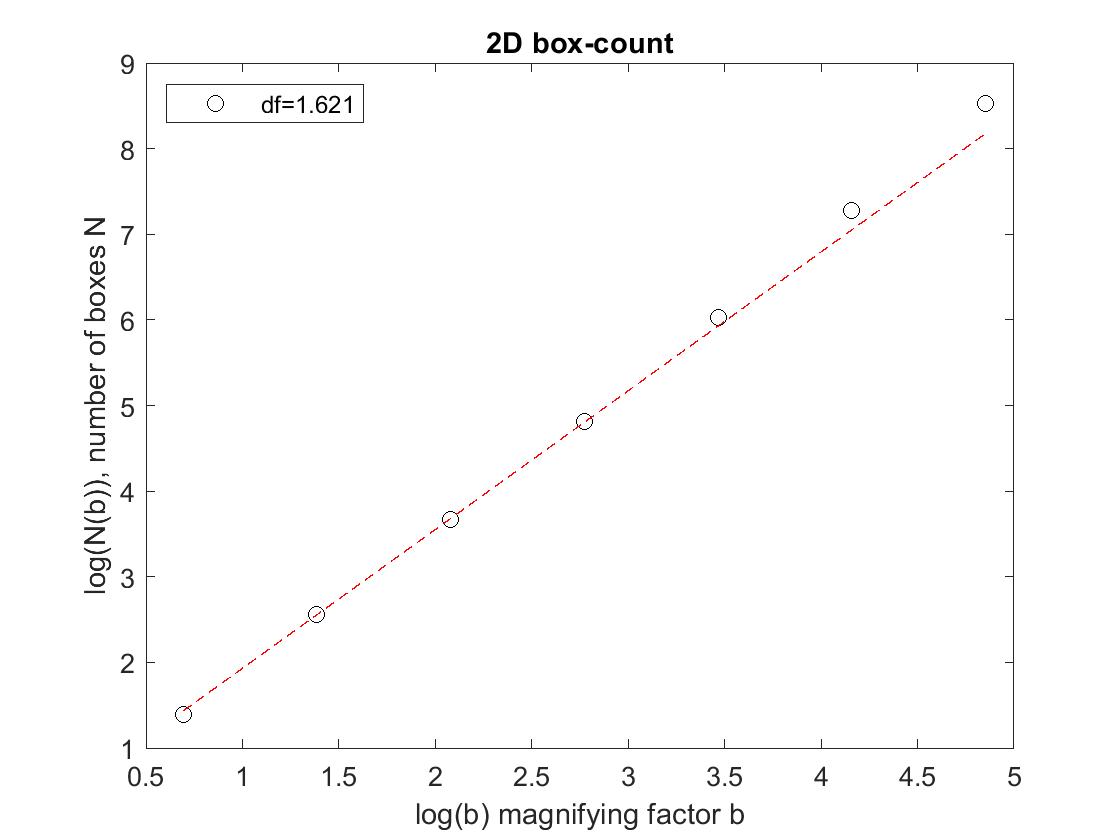
The information from the percolation analysis allowed us to create a bare bones structure to characterise the city growth using population density. This analysis is an important preliminary step in order to better understand how the population is distributed spatially in Freetown. These results would serve as a basis for further research that involves providing resources to the population and understanding the market in Freetown.
Estimating Movement and Travel
The distribution for the number of trips within the region to the city of Freetown was generated using an extended radiation model.
Places receiving and generating the most trips

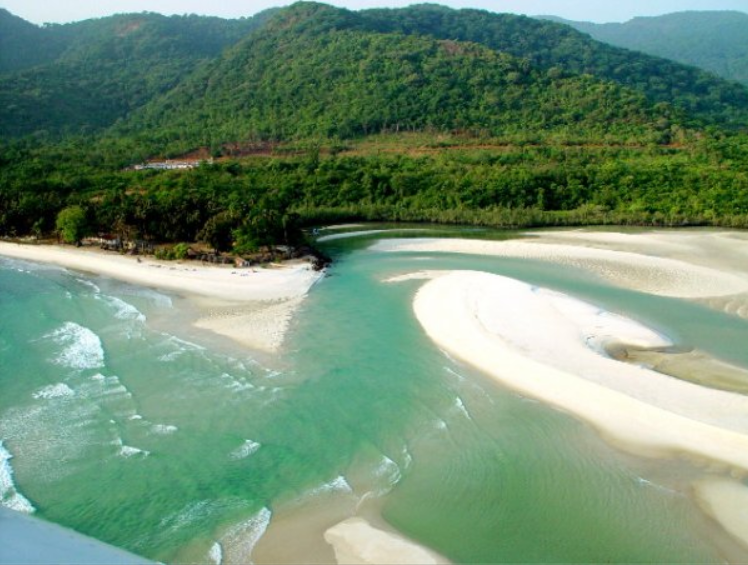
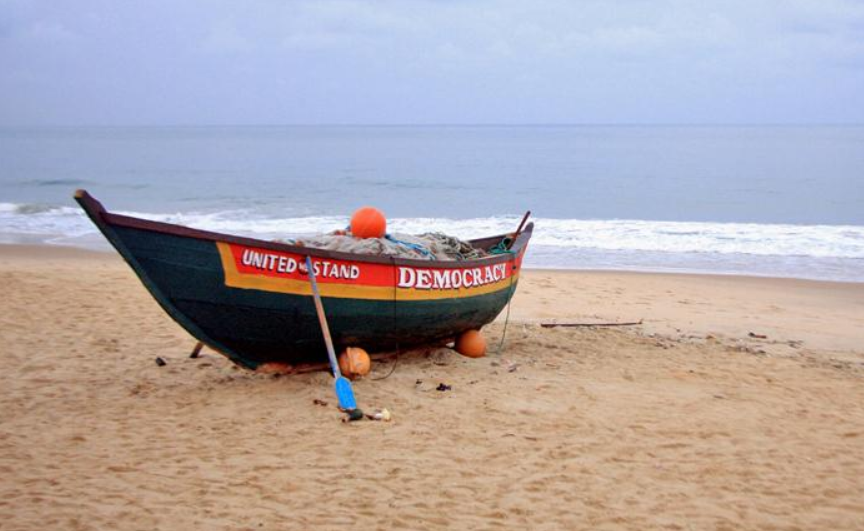
Figure 12: Visualization of place receiving the most trips - Lumley Beach (8.4737, -13.2834) and points of origin for trips.
Lumley Beach is one of the most famous attractions in Freetown. The reason why it attracts most trips is the dense distribution of nearby tourist destinations like restaurants or clubs which results in the high POI around it.
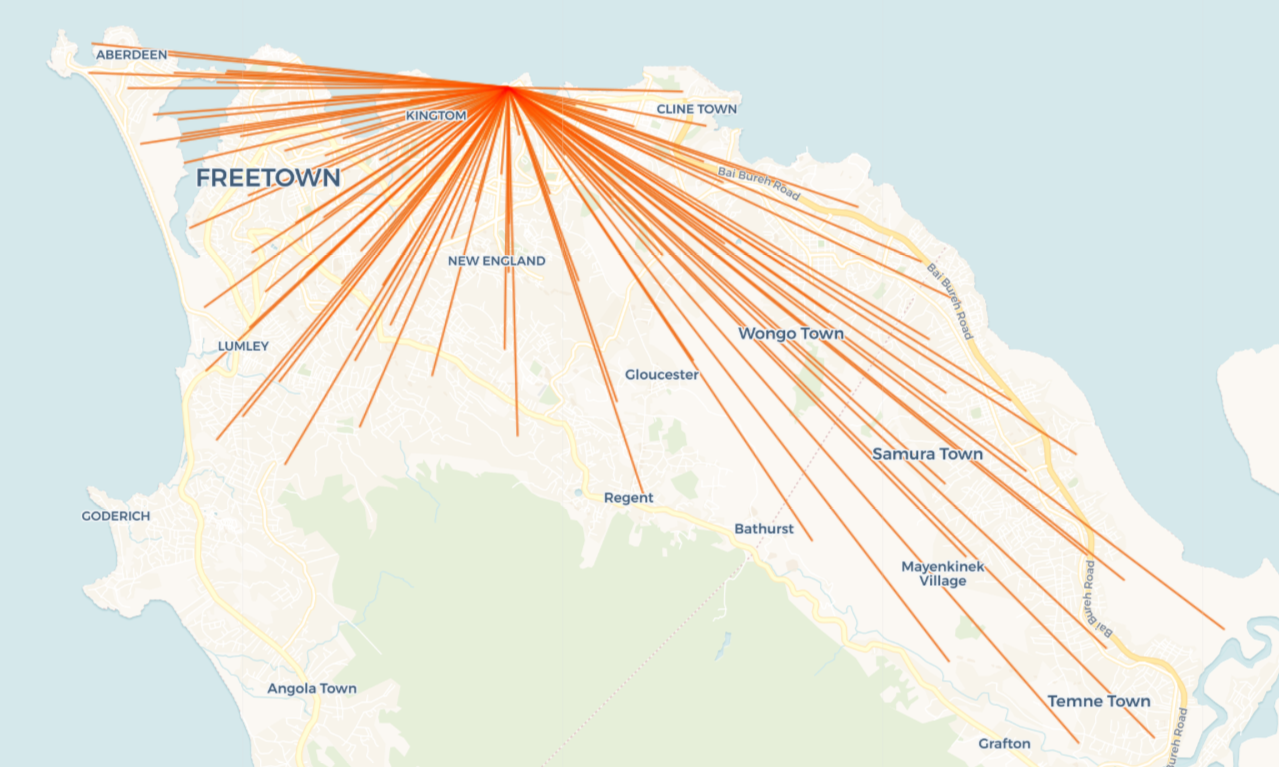
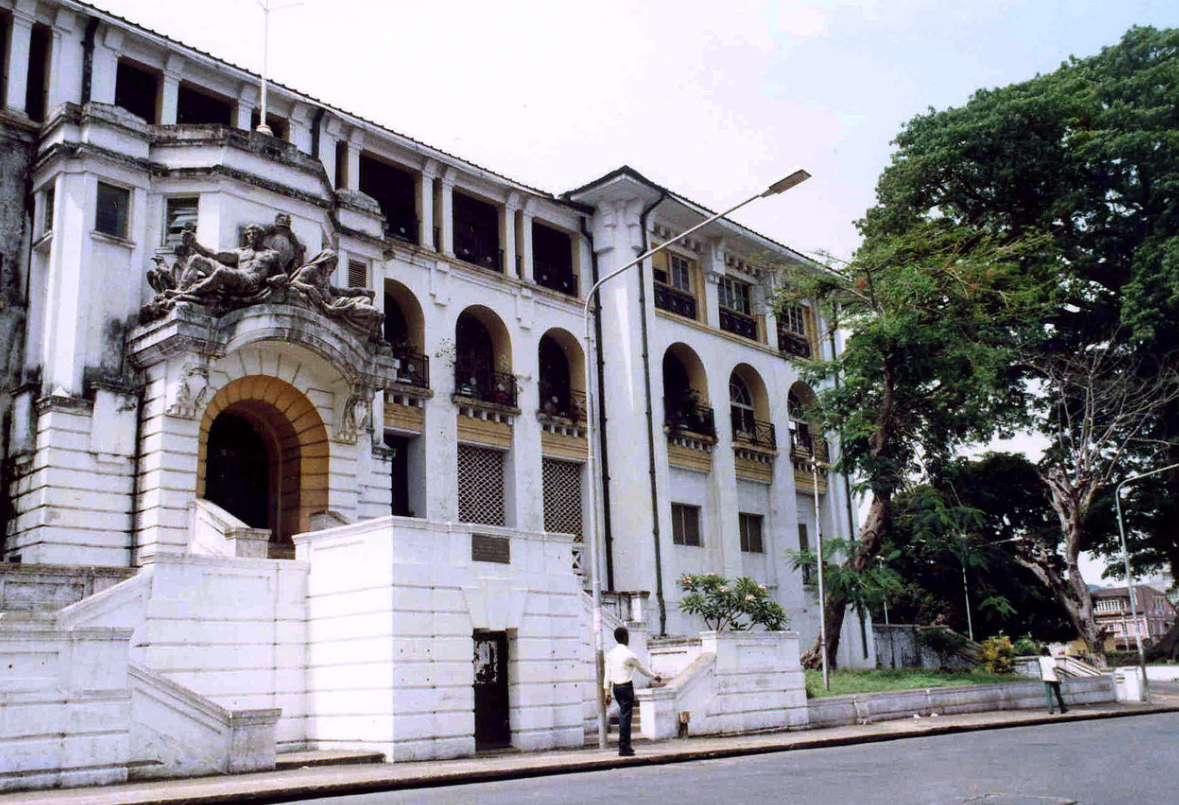

Figure 13: Visualization of place receiving the most trips and points of interest near that destination - Cotton Tree, an iconic symbol of Freetown, the capital city of Sierra Leone (8.4871, -13.2356).
In addition a route network model was also developed with generates metrics such as measures of centrality and can be used to investigate the city’s susceptibility to natural hazards and accessibility to key locations such as schools and hospitals. In the future, we plan to fit our model to historical data to observe whether or not our growth model captures the city spreading accurately.
References
-
Nelson, Andrew, et al. Freetown - Characterizing a City in a Data- Scarce Environment. Freetown - Characterizing a City in a Data- Scarce Environment.