... because loving your data should never be a solitary activity.
Well, it's #LoveData week again, and there'll be lots of torrid rumors floating around. Let's start with these three truths:
1. All data are NOT created equally.
2. Using data makes it better.
3. Together, researchers can create a better world for other researchers – and for those who benefit from their research.
Last week, the folks at the Integrated Public Microdata Series (IPUMS) announced a new beta data offering -- the Medical Expenditure Panel Survey (MEPS). This release in their Health Series – one of nine broad categories of harmonized data collections they harmonize and distribute – exemplifies these truths.
All data are NOT created equal.
The data that social scientists work with come from increasingly diverse sources – direct observation, interviews, surveys, administrative records, social media, born-digital and OCR'ed text, satellite imagery…. the list goes on and on. The quality and suitability of these data for addressing different research questions varies by source, of course, but there are also huge differences within each mode of data collection. The IPUMS projects are built from previously collected secondary data – usually governmental surveys or censuses – that rely on well designed and documented sampling frames, rigorously tested data collection instruments, data collection by trained staff, data consistency and completeness checks, and identification of appropriate weights and sampling decisions that allow researchers to generate well-founded estimates and confidence intervals.
The MEPS itself is an ongoing panel survey started more than 20 years ago by the Agency for Healthcare Research and Quality (AHRQ). It has two components - the Household Component (HC) and the Insurance Component (IC). The HC data (the component that IPUMS has created harmonized data from) reflect survey responses from members of households and their medical providers, while the complementary IC data are based on a survey of employers that collects health insurance plan information. It's a short longitudinal panel, and members of these households are interviewed five times over a two year period, with new samples selected every year. (In practice, because the IPUMS harmonized the "full-year consolidated files", individuals will have only records from two adjacent years). A broad range of topics are asked about in those two years – ranging from core demographic variables, ethnicity/nativity, and income, to medical conditions, to utilization of emergency rooms, medical office visits, expenditures by type, and health care insurance coverage.
Using data makes it better.
As you might expect, in collecting data over two decades, new questions are asked, old questions are asked in new ways, and the same questions get coded into different response categories or asked from different groups of respondents. These changes usually reflect a better understanding of what is important to researchers or policy-makers, or ways to ask questions to elicit better or more complete responses. (So, Yay! For the data collectors).
But…
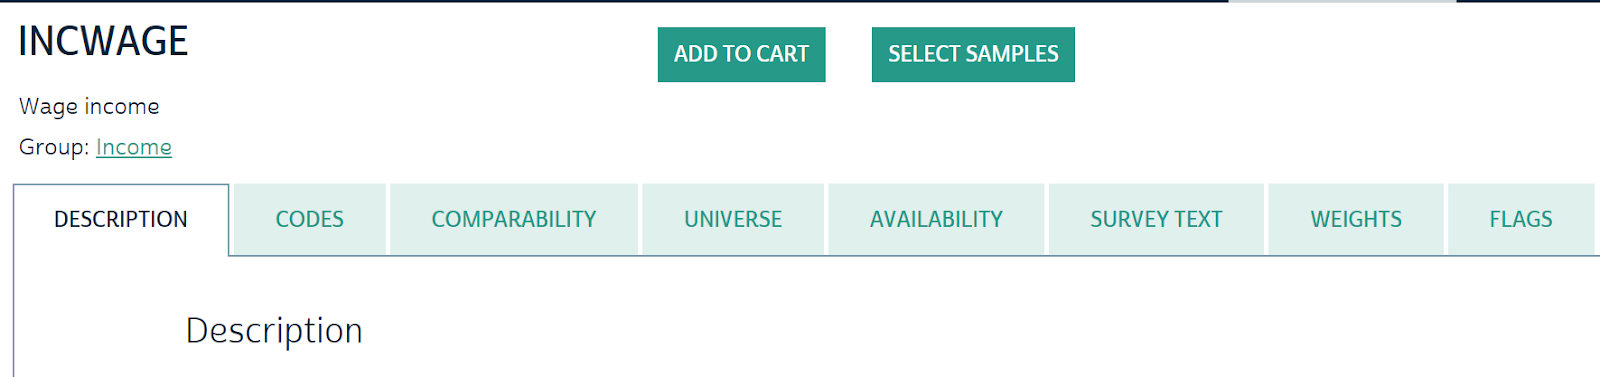
Changing questions, responses, or universes make it HARD for researchers who are looking at changes over time, examining trends, or investigating the impacts of policy changes. What staff at IPUMS have done is harmonized the data across all years, so that – to the extent possible – a variable with the same name and set of response categories provide information across the entire span of time. They then document that process, and identify a description of the variable, how it is coded, how comparable it is over time, who the data is available for, how the question was worded, weights (if any) that should be used when analyzing the variable, and relevant flags (e.g. imputed status) that researchers may want to consider in their analyses.
Improving data doesn't stop with the collectors, elaborating questions in response to new needs or old problems. Nor does it stop with data enhancers, like IPUMS, who harmonize and document the data in ways that make it more readily usable to researchers. It ultimately relies on the crowds or researchers who use it – and report problems and concerns.
The IPUMS MEPS is a beta release. That means the chance for researchers to improve the data is correspondingly greater – and IPUMS rewards each researcher who discovers errors.
Yes – serve your fellow researchers by improving the data they rely on AND score a mug for your morning latte.
Together, researchers can create a better world for other researchers – and for those who benefit from their research.
Making data usable is a complicated process, and involves researchers (and their ever important funders) from well before a research design is sketched out or data are collected. Problems and concerns are conceptualized, questions about the processes that problems are embedded in are asked, ways to tease out causality and differentiate between competing explanations are developed, and potential data to support explanations are specified.
Data collection is a process that is equally complicated, and relies both on deep wells of expertise and constantly evolving tools and technologies. Then data are produced, enhanced, checked for consistency and completeness, weighted and compared with other data, analyzed, curated, matched, linked, extended…. and increasingly made available for every one of use to use. Using secondary data allows us to stand on the shoulders of giants --- who are standing on the shoulders or giants – who are standing …. well, let's just say it's giants all the way down.
IPUMS – and organizations like them – are incredible resources that both support researchers and harness the enormous curiosity and creativity and love (Did I mention this is #LoveData18 week?) of the value of evidence to help create better resources for all.
Research globally, find resources locally: Loving your data should never be a solitary activity.
IPUMS is an important actor in building a better data world – but you don't need to go to Minnesota to learn about and use some of the enormous data resources available to researchers at Berkeley. Stop by D-Lab to learn about resources or take workshops. Delve into non-public restricted-use versions of MEPS and other Federal data sets at the Berkeley Federal Statistical Research Data Center (FSRDC). Request data that you (and fellow researchers at Berkeley) can use from the Library's Data Access and Acquisition Program (DAAP). Visit the Doe Library DataLab.
Have fun.
And don't forget to love your data.
