I’ve learned a lot through the D-Lab, from Python and basic coding to automated text analysis and web scraping. In the spirit of paying it forward, this blog post provides a tutorial on one specific project that I was able to perform using the skills I gained at the D-Lab: analyzing human rights media coverage. What determines American media coverage on human rights? How does it vary over time and space? What characterizes it substantively? With the help of a little R and Python, I analyzed thousands of New York Times articles covering human rights violations in foreign countries using automated text analysis. But, like Laura Nelson’s wonderful blog post a couple months ago, this post showcases tools that can be used towards a variety of topics and questions in the social sciences.
It took me about one semester to complete this project from start to finish. When I started, I had a basic understanding of coding logic but had minimal experience with R or Python. I had never used LexisNexis before, had very limited knowledge of statistical techniques and absolutely no knowledge on automated text analysis. But with the help of D-Lab trainings and consultants, I was able to get up to speed on requisite skills. I’m still not fluent in any of the tools highlighted here; but I know enough now that I can teach myself, troubleshoot, solve problems, and get done what I want to accomplish.
The following outlines the process by which I completed the project, including information on how I gained the various skills required for different steps, as well as coding snippets and other helpful tips.
Data Collection
My process of building a corpus of human rights coverage is very similar to Laura Nelson’s project of analyzing gender differences in business reporting. I went into LexisNexis and downloaded over 10,000 articles having to do with human rights violations in the New York Times. LexisNexis can be a bit daunting at times, so here are some helpful tips:
- In the initial search, I searched for the term “human rights” and selected the source as “New York Times, The.”
- As for the date, I wanted to select all articles from 1980-2012. But because LexisNexis limits downloads to no more than 500 articles at a time, I had to search and download in batches. So at first I searched and downloaded all articles in 1980, and then in 1981, etc, in order to get my search (and thus download) results below 500. This involves a bit of time, especially if you’re downloading a large corpus. This is your chance to listen to that new record you’ve been meaning to get to!
- Because I was only interested in coverage having to do with human rights violations, I went into the filters and selected the subject “human rights violations” to filter my search results. In addition to subject, you can also filter your results by geography, language, people, etc.
- Once you’re ready to download, be sure to select the format at “Text”, and the document view as “Full w/ Indexing.” This gives you not only the body of the article, but metadata such as Geography and Subject keywords, which will be helpful later. If you’re filtering by subject or something else, be sure to select document range as “Current Category”
Once I had all of my text documents, each containing up to 500 articles, I then used Neal Caren’s python script to transform the text files into comma separated values (CSV) file. This transformed my output into a spreadsheet, with each row being an article, and columns for values such as date, author, number of words, and of course the text of the article itself. It also comes with metadata such as subject and geography terms, which are produced by LexisNexis’s algorithms. I cannot attest to their precise accuracy, but in my experience, they have been good enough.
Data Cleaning and Categorization
Armed with my CSV file, I then went into R and began cleaning and categorizing my data.
The first variable I added was date, which I extracted using LexisNexis’s DATE variable:
total$DATE <- as.character(total$DATE)
total$YEAR <- substr(total$DATE, nchar(total$DATE)-2, nchar(total$DATE))
total$YEAR <- as.integer(total$YEAR)
I then set out to categorize each article by what country it’s probably about. This was definitely the most difficult part of the project in terms of validity. Other scholars doing similar projects have relied on hand-coding articles, or looking for country names within 10 words of the term “human rights.” My strategy was to use LexisNexis’s “Geography” (sometimes called “Country”) terms. This value comes in a list format with percentage accuracy, like so:
NIGERIA (99%); UNITED STATES (98%); SOMALIA (92%); SOUTH AFRICA (79%); AFRICA (79%); UGANDA (79%);
These percentages have to do with the confidence level of LexisNexis’s algorithm. With the help of D-Lab’s consultants (especially Dav Clark) I selected the country with the highest percentage in the GEOGRAPHIC field, and put that country in a new column. In the above example, “Nigeria” would win out as the country value. Here’s the function, which I applied to all rows in my dataframe:
country.percentages <- function(x){
     geo <- as.character(total$GEOGRAPHIC[x])
     countries <- unlist(strsplit(geo, ';\\s*'))
     country.percents <- sub('.*\\((\\d+)%.*', '\\1', countries)
     country.percents <- as.list(country.percents)
     country.percents[(nchar(country.percents) > 2)] <- NULL
     country.percents <- unlist(country.percents)
     country <- grep(max(country.percents), countries, value=T)[1]
     return(country)
}
I also applied other techniques to classify articles by country, such as looking for country names in the title field, searching for particular keywords (e.g. “Saddam Hussein” is usually about Iraq), and so on. I compared these parallel results to the original technique detailed above and found that they had a high level of consistency.
Now that I had each article categorized by country, it was easy to categorize each article by region. I made a list of all countries in six regions (relying on the consensus of other scholars for what constitutes a “region”) and then used this list to aggregate my COUNTRY field into a REGION value:
africa <- c("burundi","comoros","dijibouti","eritrea","ethiopia","kenya","madagascar","kenya","malawi", "mauritius","mayotte","mozambique","reunion","rwanda","seqychelles", "somalia", "south sudan", "uganda","tanzania","united republic of tanzania", "zambia","zimbabwe","angola","cameroon","central african republic", "chad", "congo","democratic republic of congo","equatorial guinea","gabon", "sao tome and principe","botswana","lesotho","namibia","south africa","swaziland","benin", "burkina faso","cabo verde","cote  d'ivoire","gambia","ghana","guinea","gunea-bissau", "liberia","mali","mauritania","niger","nigeria","saint helena","senegal","sierra leone", "togo", "cape verde","guinea-bissau","djibouti","democratic republic of the congo", "ivory coast", "africa","losotho")
africa <- paste(africa, collapse='|')
africa.index <- (grepl(africa, total$COUNTRY,ignore.case=T))
total$REGION[africa.index] <- "Africa"
Now I had thousands of New York Times articles about human rights, each with metadata for date, country, region, subject and so on. There was a lot I could get out of this.
Analysis
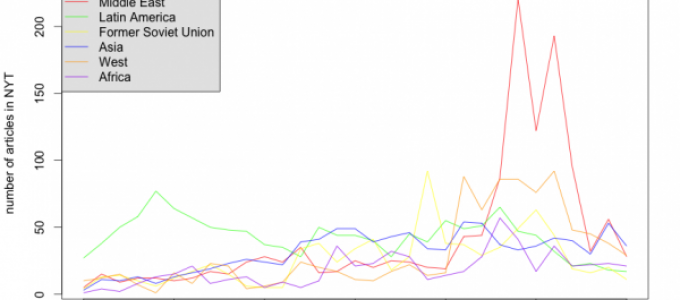
The first thing I wanted to know was how regional focus of human rights reporting changed over time. I had a suspicion that coverage of the Middle East and North Africa increased after 9/11 and wanted to test this hypothesis. Because I was only interested in American coverage of other countries, I removed human rights classified as “United States” and was left with an N of 5914 articles from 1980 to 2010. I then created a new dataframe that contained the number of articles for each region (row) in each year (column). I then plotted these values using the plot function in R:

Consistent with other scholar’s findings, Latin America was the most covered region during the 1980s and human rights reporting stayed relatively high during the 1990s. However, after 2001, the trend is clear: Middle East and North Africa (MENA) reporting skyrocketed and dwarfed all other regions. In fact, using multivariate statistical regression techniques, I found that, compared to MENA, other regions were much less likely to be covered by the New York Times for human rights abuses, all else equal, after 2001. Whether a country was in the MENA region was a strong predictor of whether it received significant human rights coverage during this time.
So we know that human rights reporting varies quantitatively across region. But does it vary qualitatively as well? That is, does the substance or tone of the article differ depending on what region it’s about? In order to investigate this question, I used LexisNexis’s “subject” terms, collecting the top ten most-frequent subject terms mentioned for three regions, excluding the terms “Human Rights” and “Human Rights Violations.” This table below lists these terms with unique terms highlighted with astericks (meaning they are the only terms featured in the top ten of any region).
|
Latin America |
MENA |
Former Soviet Bloc |
|
Rebellions &Insurgencies 73 *** |
War & Conflict 130 |
War Crimes 362 |
|
International Relations 69 |
War Crimes 130 |
International Relations 48 |
|
Armed Forces 55 |
Religion 91 |
War & Conflict 41 |
|
Terrorism 50 |
Terrorism 89 |
Religion 28 |
|
Armies 29 *** |
Taliban 77 *** |
Terrorism 27 |
|
Extradition 29 *** |
United Nations Institutions 61 |
Genocide 17 |
|
War & Conflict 26 |
Investigations 47 |
United Nations Institutions 16 |
|
Investigations 24 |
Genocide 41 |
Armed Forces 15 |
|
Religion 23 |
Hamas 36 *** |
Refugees 15 *** |
|
Torture 21 *** |
Muslims & Islam 36 *** |
Investigations 14 |
While many regions share overlapping terms, the ranking of these terms differ. Coverage of human rights in Latin America are more likely to discuss rebellions and insurgencies, armies, extradition and torture. Coverage of the MENA region, in contrast, is more likely to cover the Taliban, Hamas and Islam. The former Soviet Bloc features coverage of refugees. Surprisingly, terrorism was listed highly in all three regions, suggesting that there exists a global relationship between terrorism coverage and human rights coverage.
Lastly, I used automated text analysis in order to compare human rights coverage across regions – a skill I gained through D-Lab’s text analysis offerings. Using Python to analyze word frequencies, I looked for the most “distinctive” words across the entire corpus of human rights articles in Latin America, MENA, and the Former Soviet Bloc. Laura Nelson explains this technique is more detail here. Here are the top 20 most distinctive words for each of my three regions of interest:
Former Soviet Bloc: milosevic, serbian, bosnian, war, crimes, bosnia, serbs, mr., tribunal, kosovo, serb, serbia, nato, ethnic, russian, former, karadzic, yugoslavia, russia, hague Latin America: military, rights, human, general, president, government, pinochet, el, salvador, army, argentina, chile, abuses, political, colombia, guatemala, former, officers, police, armed
MENA: saddam, council, gaza, afghan, women, turkey, islamic, arab, iran, nations, afghanistan, sudan, darfur, taliban, palestinian, israeli, israel, iraqi, hussein, iraq
Many of these distinctive words are, unsurprisingly, proper nouns such as the names of people or countries, e.g. Milosevic, Serbia, Iran, Iraq, etc. I included these words, however, because it gives insight into who and where the media focus on when discussing human rights. It might seem obvious that human rights coverage of the MENA region would mention Saddam Hussein, but perhaps less obvious is why Turkey is present but Saudi Arabia is not.
The non-proper-nouns are interesting as well. In the (former) Soviet Bloc, for instance, the words “ethnic” is included as a distinctive word, suggesting that human rights abuses were framed as a result of ethnic conflict. In Latin America, distinctive words include “political,” “military,” “police,” and “armed”, suggesting that human rights issues were framed as part of an armed political conflict. Interestingly, “women” and “Islamic” are frequent in coverage of the MENA region, suggesting that the media focuses intently on women’s rights and frames these rights around religious issues when discussing this region.
Conclusion
In a relatively short period of time, I was able to reproduce findings that took other scholars a lot longer. I was also able to explore other aspects beyond quantity of coverage, such as the substance and tone of coverage, using computational text analysis. While no automated text analysis is perfectly valid, my results suggest interesting findings and hypotheses that I can then explore using other methods.
For my dissertation, I expand on these techniques to look at variation of human rights reporting across papers as well as across subject matter. For instance, how does coverage of women’s rights specifically vary across time and space? I also apply additional skills that I gained at the D-Lab, such as web-scraping, to collect and analyze other data beyond media coverage, i.e. Amnesty International urgent action reports.
A project like this was beyond my reach a year ago. But after taking a handful of D-Lab trainings, and a lot of practice, I was up to get up to speed on the basic technological skills required to effectively utilize these tools. By no means I am an expert programmer. But with a bit of hand-holding, I was able to gain the basic foundation – and more importantly the confidence – I needed to teach myself and explore on my own. Hopefully this short tutorial has demonstrated that one need not be a computer scientist in order to harness the power of computers for social science research.
